
The average student loan debt is $38,407.49 per borrower, though the exact amount varies significantly from person to person.
The information provided on this website does not, and is not intended to, act as legal, financial or credit advice. See Lexington Law’s editorial disclosure for more information.
Conversations around student loan debt forgiveness have called to attention a staggering statistic: In the end of 2024, Americans held a collective $1.64 trillion in federal student loans spread amongst more than 42 million borrowers.
Using the most recent available data from the U.S. Department of Education, we’ve compiled detailed statistics about the average student loan debt in America. Read on to see more, or use the links below to jump to a specific section.

Table of contents:
- What is the average student loan debt?
- By state
- By age
- By race and gender
- By school type
- By repayment status
What is the average student loan debt?
The average amount of student loan debt for Americans is $38,407.49 per borrower, though the exact amount varies significantly from person to person depending on age, gender and education level, among other characteristics.
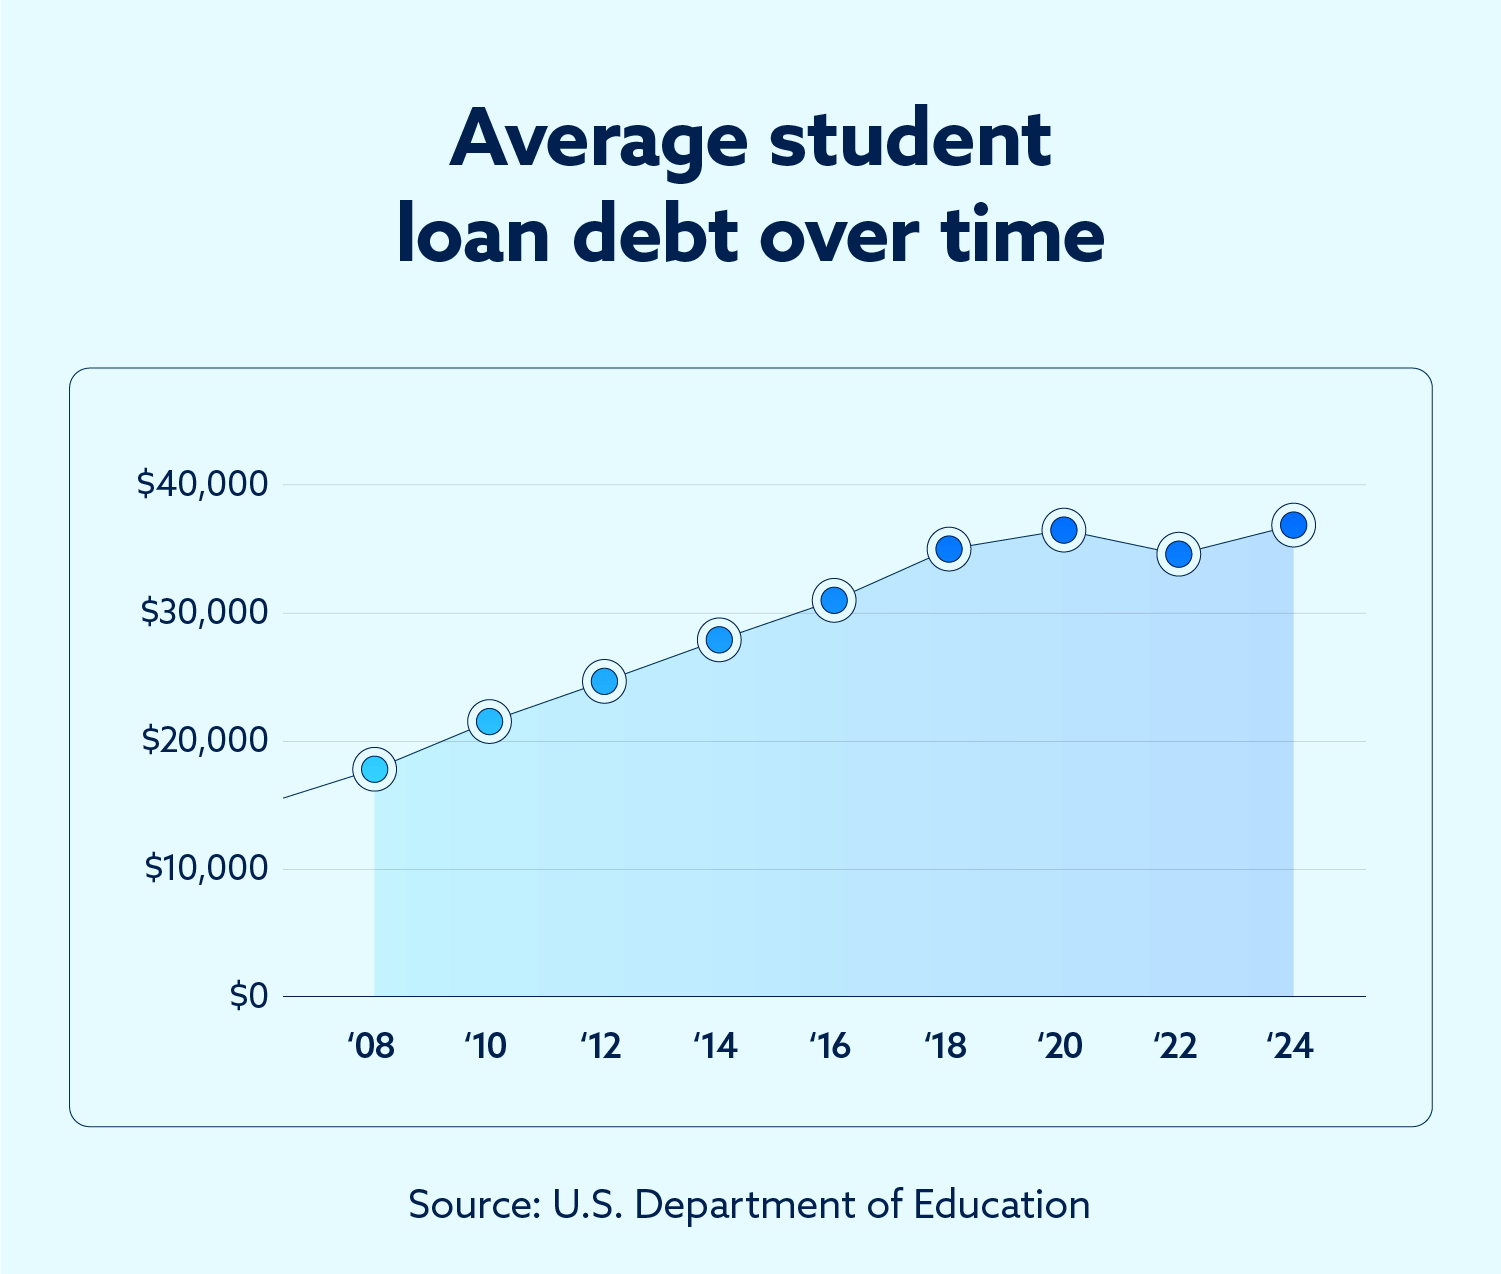
The following chart captures the staggering rise of average student loan debt since 2007 by displaying the average debt, total debt and total number of borrowers and how they have changed over time.
| Year | Average debt | Total debt | Borrowers |
|---|---|---|---|
| 2007 | $18,233.22 | $516 billion | 28.3 million |
| 2008 | $19,297.66 | $577 billion | 29.9 million |
| 2009 | $20,467.29 | $657 billion | 32.1 million |
| 2010 | $21,865.89 | $750 billion | 34.3 million |
| 2011 | $23,232.88 | $848 billion | 36.5 million |
| 2012 | $24,751.96 | $948 billion | 38.3 million |
| 2013 | $26,262.63 | $1.04 trillion | 39.6 million |
| 2014 | $27,764.13 | $1.13 trillion | 40.7 million |
| 2015 | $29,086.54 | $1.21 trillion | 41.6 million |
| 2016 | $30,732.86 | $1.30 trillion | 42.3 million |
| 2017 | $32,159.62 | $1.37 trillion | 42.6 million |
| 2018 | $33,566.43 | $1.44 trillion | 42.9 million |
| 2019 | $35,198.14 | $1.51 trillion | 42.9 million |
| 2020 | $36,596.74 | $1.57 trillion | 42.9 million |
| 2021 | $37,096.77 | $1.61 trillion | 43.4 million |
| 2022 | $37,471.26 | $1.63 trillion | 43.5 million |
| 2023 | $37,557.60 | $1.63 trillion | 43.4 million |
| 2024 | $38,407.49 | $1.64 trillion | 42.7 million |
Source: U.S. Department of Education
After accounting for inflation, the average student loan debt has increased by more than 50 percent since 2007. According to the Pew Research Center, the median purchasing power of Americans has hardly risen in the past four decades, so it stands to reason that student loan debt is an ever-increasing source of financial burden.
Student loan debt has ballooned over the past 17 years — and in that time, it has passed credit card debt in terms of non-housing debt in the United States, according to data from the Federal Reserve Bank.
At the beginning of 2007, just 28 million borrowers held around $500 billion in student loan debt — or an average of $18,233 per borrower. In 2024, the number of borrowers increased to about 42 million, who collectively hold more than $1.6 trillion in debt, which amounts to an average of $38,407.49 per person.
Although average student loan debt is more than $38,000, this figure is somewhat skewed since some students have extraordinarily large sums of debt that raise the overall average. The greatest number of borrowers owe just $10,000 to $20,000 in student loans, but more than 3.5 million are over $100,000 in debt from federal student loans.
Average student loan debt by state
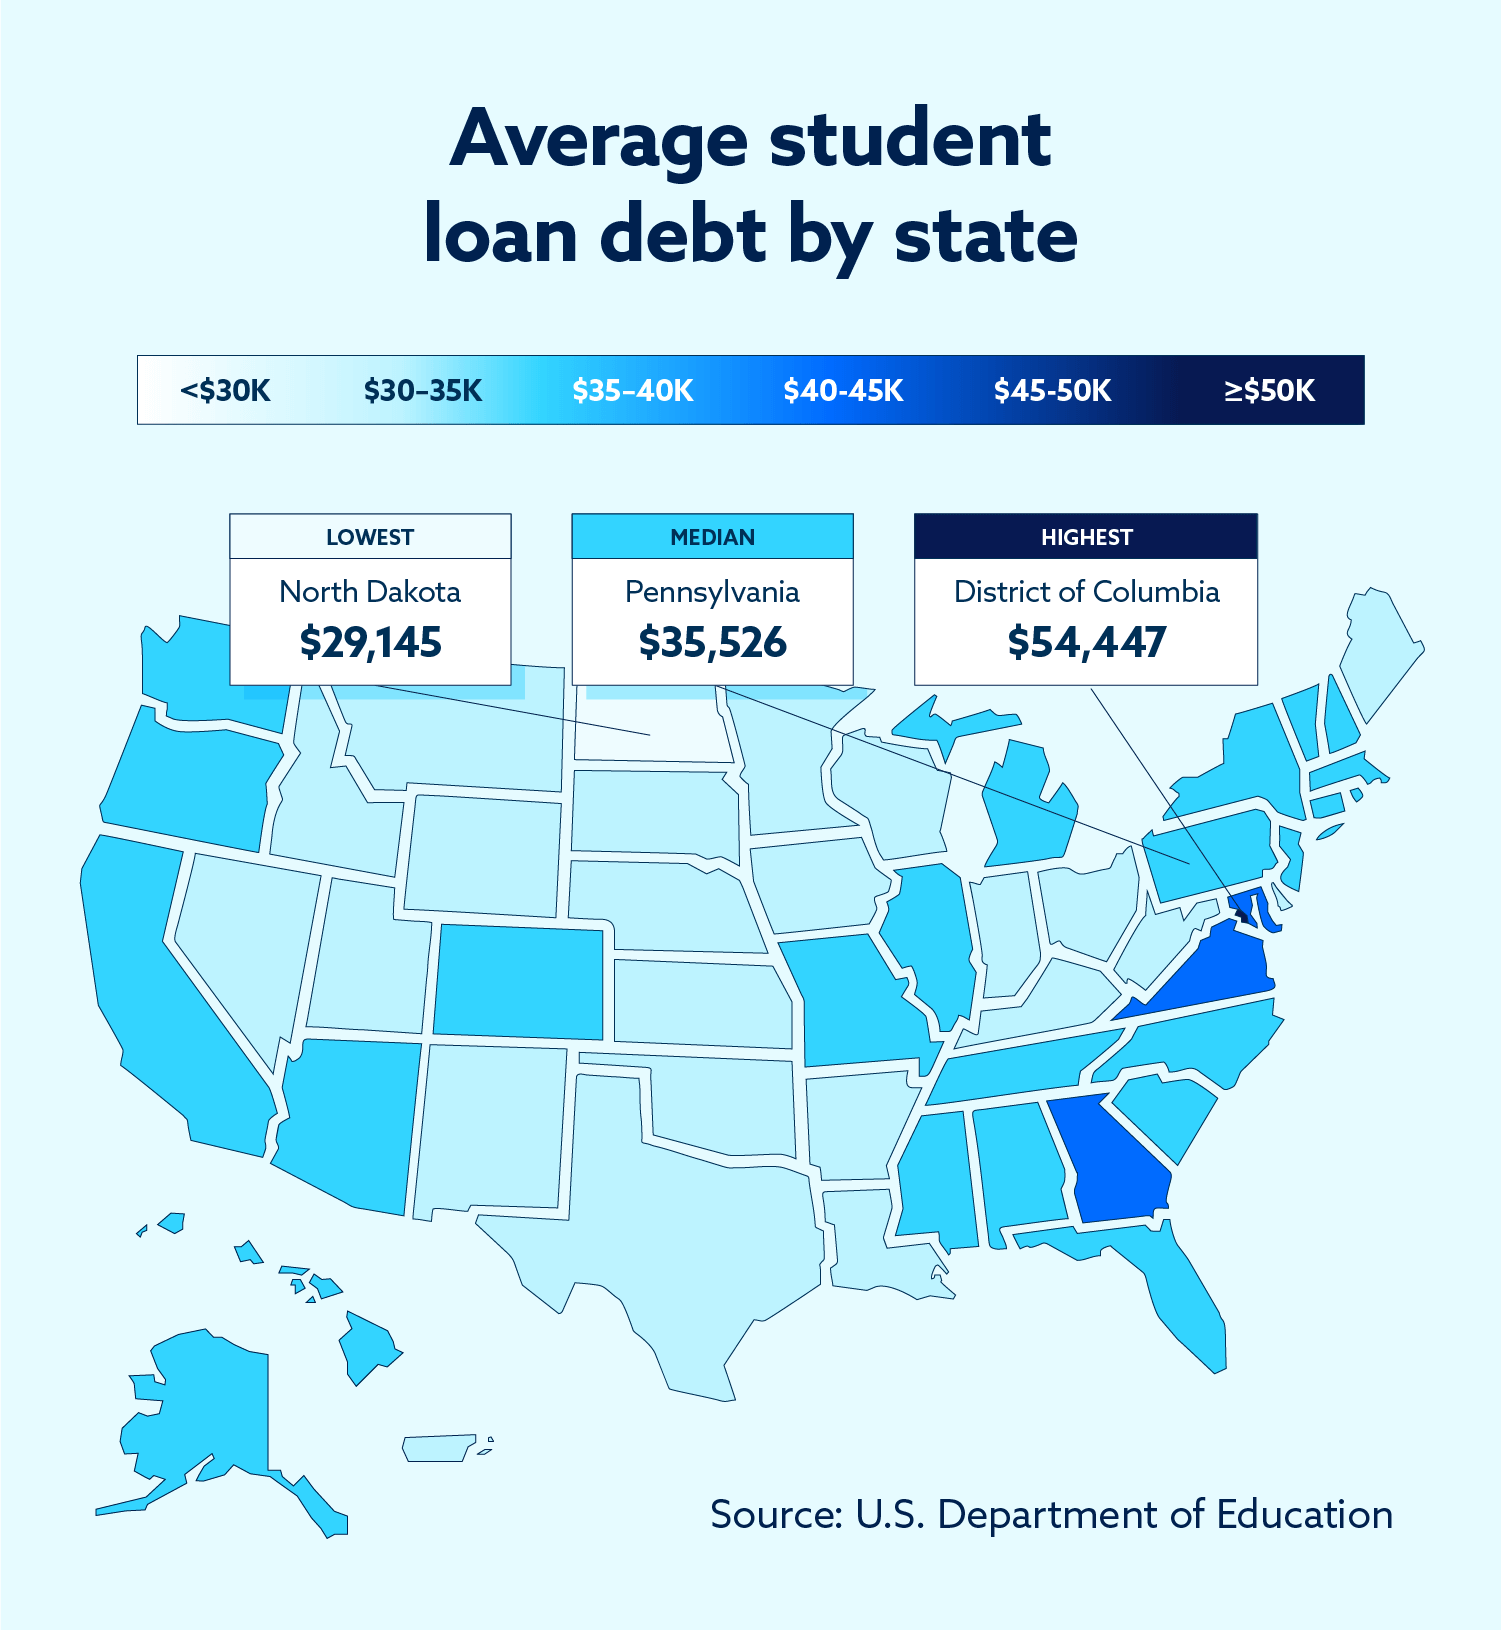
While student loan debt is a national concern, the effects are felt differently in various states across the country. Many states have average student loan debt that hovers around the $38,407 national average, but there are several notable outliers.
North Dakota, for instance, has the lowest average student loan debt at $29,145.87, while Maryland has the highest average student loan debt at $43,927.97.
Though they are not technically states, the District of Columbia has a very high average student loan debt of $54,447.45, and the U.S. territory of Puerto Rico has a relatively low average student loan debt of $32,090.92.
Here’s a list of U.S. states along with their average student loan debt, total student loan debt and total borrowers using data as of September 30, 2024:
| State | Average debt | Total debt | Borrowers |
|---|---|---|---|
| Alabama | $37,709.18 | $24.8 billion | 657,200 |
| Alaska | $35,563.37 | $2.4 billion | 67,400 |
| Arizona | $35,876.07 | $32.8 billion | 914,400 |
| Arkansas | $34,141.65 | $13.8 billion | 403,900 |
| California | $38,232.91 | $151 billion | 3.95 million |
| Colorado | $37,487.50 | $29.3 billion | 781,700 |
| Connecticut | $36,900.58 | $19.1 billion | 517,200 |
| Delaware | $39,140.77 | $5.3 billion | 135,500 |
| District of Columbia | $54,447.45 | $6.4 billion | 117,500 |
| Florida | $39,814.81 | $107.5 billion | 2.7 million |
| Georgia | $42,058.82 | $71.5 billion | 1.7 million |
| Hawaii | $38,897.94 | $4.8 billion | 123,400 |
| Idaho | $33,218.26 | $7.3 billion | 219,900 |
| Illinois | $39,625.00 | $63.4 billion | 1.6 million |
| Indiana | $33,276.10 | $30.1 billion | 904,900 |
| Iowa | $30,930.23 | $13.3 billion | 430,000 |
| Kansas | $33,333.33 | $12.8 billion | 384,600 |
| Kentucky | $33,840.62 | $20.7 billion | 611,700 |
| Louisiana | $34,973.31 | $23.7 billion | 678,100 |
| Maine | $34,479.62 | $6.5 billion | 188,800 |
| Maryland | $43,927.97 | $37.1 billion | 845,200 |
| Massachusetts | $35,654.61 | $32.7 billion | 917,500 |
| Michigan | $36,857.14 | $51.6 billion | 1.4 million |
| Minnesota | $34,225.22 | $27.0 billion | 788,500 |
| Mississippi | $37,690.53 | $16.9 billion | 448,600 |
| Missouri | $35,764.48 | $29.8 billion | 832,700 |
| Montana | $34,250.39 | $4.4 billion | 128,500 |
| Nebraska | $32,549.55 | $8.1 billion | 248,900 |
| Nevada | $34,688.79 | $12.6 billion | 363,300 |
| New Hampshire | $35,400.94 | $6.8 billion | 192,200 |
| New Jersey | $38,500.00 | $46.2 billion | 1.2 million |
| New Mexico | $34,309.34 | $7.8 billion | 227,300 |
| New York | $38,520.00 | $96.3 billion | 2.5 million |
| North Carolina | $38,071.43 | $53.3 billion | 1.4 million |
| North Dakota | $29,145.87 | $2.6 billion | 89,200 |
| Ohio | $34,722.22 | $62.6 billion | 1.8 million |
| Oklahoma | $32,307.32 | $16.3 billion | 504,900 |
| Oregon | $38,226.60 | $20.3 billion | 531,200 |
| Pennsylvania | $35,526.32 | $67.5 billion | 1.9 million |
| Puerto Rico | $32,058.85 | $10.7 billion | 333,400 |
| Rhode Island | $33,061.50 | $4.9 billion | 148,200 |
| South Carolina | $38,750.97 | $29.9 billion | 771,900 |
| South Dakota | $30,996.64 | $3.7 billion | 119,400 |
| Tennessee | $37,131.75 | $33.1 billion | 891,400 |
| Texas | $34,605.26 | $131.4 billion | 3.8 million |
| Utah | $33,914.69 | $10.9 billion | 321,800 |
| Vermont | $37,660.39 | $2.9 billion | 77,100 |
| Virginia | $40,090.91 | $44.3 billion | 1.1 million |
| Washington | $37,040.32 | $29.1 billion | 786,800 |
| West Virginia | $32,372.87 | $7.4 billion | 228,600 |
| Wisconsin | $32,523.69 | $23.6 billion | 724,900 |
| Wyoming | $30,357.14 | $1.7 billion | 55,600 |
Source: U.S. Department of Education
Total student loan debt for each state correlates strongly with population, so California ($151 billion), Texas ($131.4 billion) and New York ($96.3 billion) have the largest amount of debt among all states. The smallest amount of debt belongs to Wyoming, which holds just $1.7 billion among 55,600 borrowers — though that is nearly 10 percent of the state’s population with some sort of student loan debt.
Average student loan debt by age
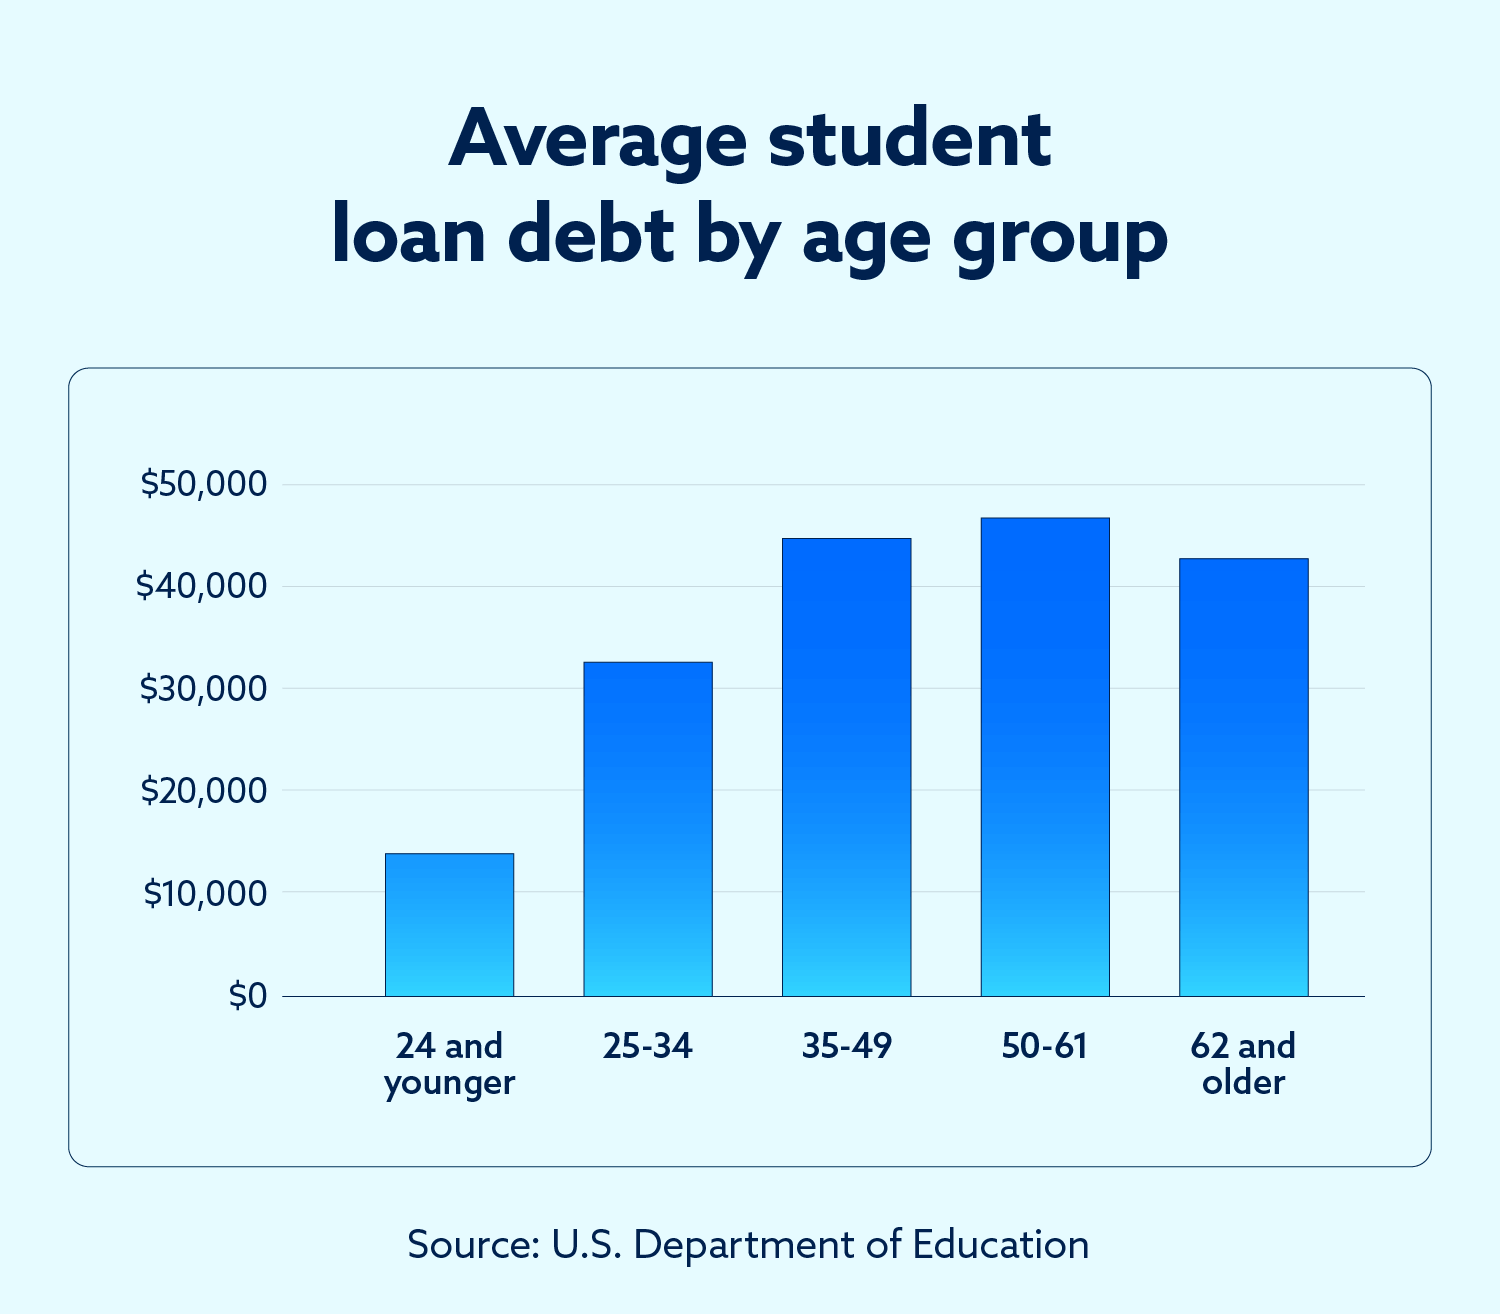
Student loan debt varies significantly by age, with those ages 50 to 61 holding the highest average debt at $46,790.32.
On the other hand, the greatest number of borrowers are ages 25 to 34 (14.7 million total borrowers), and the greatest amount of debt is held by those ages 35 to 49 ($646.6 billion total debt). Those 62 or older represent less than 7 percent of total borrowers, yet they collectively owe $121.5 billion — which is more debt than the youngest age group.
The following chart shows the average student loan debt, total student loan debt and number of borrowers for each major age group.
| Age | Average debt | Total debt | Borrowers |
|---|---|---|---|
| 24 and younger | $14,161.76 | $96.3 billion | 6.8 million |
| 25 to 34 | $33,149.66 | $487.3 billion | 14.7 million |
| 35 to 49 | $44,287.67 | $646.6 billion | 14.6 million |
| 50 to 61 | $46,790.32 | $290.1 billion | 6.2 million |
| 62 and older | $43,392.86 | $121.5 billion | 2.8 million |
Source: U.S. Department of Education
The average debt for each age group is skewed slightly upward by a small number of people who hold a significant amount of student loan debt — in some cases $200,000 or more. Across borrowers ages 25 to 61, it is most common to have between $20,000 and $40,000 of student loan debt, whereas those under 25 generally have between $5,000 and $10,000. Most borrowers above age 62 have less than $5,000 in debt.
Across all age groups, a total of 11.67 million borrowers owe more than $40,000 in student loan debt — meaning around 25 percent of total borrowers have more debt than average.
Average student loan debt by race and gender
Student loan debt is not distributed equally among races and genders, as borrowing patterns tend to vary substantially. While Asian students tend to borrow the least amount of money to fund their education, Black students tend to borrow the most.
In general, a smaller percentage of white students (67 percent) and Asian students (43 percent) took out loans for their education than Hispanic students (70 percent) and Black students (86 percent).
Here is a full look at how students of different races and genders funded their education using student loans.
| Average amount borrowed by race and gender | ||
|---|---|---|
| Race or ethnicity | Gender | Average borrowed |
| White | Male | $29,862 |
| Female | $31,346 | |
| Black or African American | Male | $35,665 |
| Female | $37,558 | |
| Hispanic or Latin American | Male | $27,452 |
| Female | $27,029 | |
| Asian | Male | $25,507 |
| Female | $25,252 | |
Source: American Association of University Women
Many women take loans out for four-year for-profit universities, which tend to charge higher tuition, leading to larger student loan burdens after graduation.
The American Association of University Women found that women hold nearly two-thirds of student loan debt, and many women manage debt payments while also managing housing, food or childcare costs on an average post-graduation salary of about $35,000.
Among Black women, 57 percent of college graduates report difficulty repaying student loans despite earning a bachelor’s degree or higher.
A 2022 study by The Education Trust also found that 12 years after enrolling in college, Black women find themselves owing 13 percent more than the amount they initially borrowed. On the other hand, White men have managed to reduce their debt by 44 percent in the same time frame.
Average student loan debt by school type
Public school loans account for the highest percentage of student loans, making up over 44 percent. Private schools follow closely behind at 35.6 percent. Proprietary schools, which include for-profit colleges and universities, make up 16.1 percent of all student loans, while foreign schools account for just over one percent.
Students who attended a foreign school have the highest average debt at $116,500.00, which is significantly more than those who attended proprietary schools, whose average debt is $22,471.20.
| School type | Average debt | Total debt | Borrowers |
|---|---|---|---|
| Public | $28,827.70 | $728.0 billion | 25.3 million |
| Private | $42,468.80 | $585.8 billion | 13.8 million |
| Proprietary | $22,471.20 | $264.9 billion | 11.8 million |
| Foreign | $116,500.00 | $23.3 billion | 200 thousand |
Source: U.S. Department of Education
Average student loan debt by repayment status
The average student loan debt varies according to repayment status, as student loans are treated differently for students in school, throughout the post-graduation grace period, amid repayment or during deferment, forbearance or default.
For students in school and during the post-graduation grace period, no payments are required — though interest may continue to accrue for unsubsidized loans. Deferment and forbearance are similar, though no interest accrues with deferment as it typically does with forbearance.
The following chart shows the average student loan debt for those with different repayment statuses. Keep in mind that the below chart is based on data from Q4 2024. Prior to that, in March 2020, many major shifts occurred in loan statuses due to the Coronavirus Aid, Relief, and Economic Security (CARES) Act.
| Status | Average debt | Total debt | Borrowers |
|---|---|---|---|
| In school | $18,065.57 | $110.2 billion | 6.1 million |
| Grace | $24,000.00 | $38.4 billion | 1.6 million |
| Repayment | $32,032.09 | $599.0 billion | 18.7 million |
| Deferment | $40,687.50 | $130.2 billion | 3.2 million |
| Forbearance | $55,277.78 | $497.5 billion | 9.0 million |
| Default | $22,200.00 | $88.8 billion | 4.0 million |
Source: U.S. Department of Education
While temporary government action through the CARES Act offered a reprieve to millions of student loan borrowers, payments restarted in October 2023.
The impact of student loans on your credit
Student loan debt and payments affect your credit, so getting a handle on that debt is crucial. While making on-time payments can help you build credit, making late payments or missing them altogether can have a major negative impact on your credit score.
Juggling student loans with other debt, like mortgages and auto loans, can be overwhelming and make it hard to maintain good credit, but professionals can provide the support you need to overcome these temporary obstacles. If you need help cleaning up your credit report or getting your credit back on track, learn more about our service.
Note: Articles have only been reviewed by the indicated attorney, not written by them. The information provided on this website does not, and is not intended to, act as legal, financial or credit advice; instead, it is for general informational purposes only. Use of, and access to, this website or any of the links or resources contained within the site do not create an attorney-client or fiduciary relationship between the reader, user, or browser and website owner, authors, reviewers, contributors, contributing firms, or their respective agents or employers.