
The information provided on this website does not, and is not intended to, act as legal, financial or credit advice. See Lexington Law’s editorial disclosure for more information.
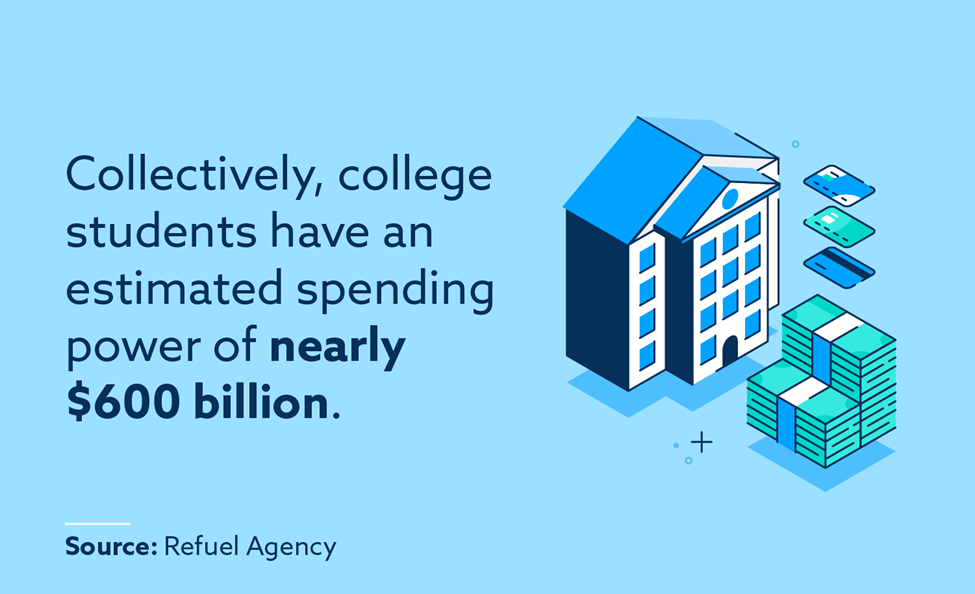
Collectively, college students have an estimated spending power of nearly $600 billion.
College students face a crucial point in their financial lives—it’s the time where most take out student loans and apply for their first credit cards. Very often, they graduate with the burden of debt.
According to data from the Education Data Initiative, the cost of college has increased eight times faster than wages in the period from 1989 to 2016. As a result of that, student loan debt often sets college students back at the onset of their careers, in turn making it difficult for them to participate fully in the economy or the housing market.

Nonetheless, college students have a significant amount of spending power and use their discretionary income for purchases outside of tuition and related expenses. Read on to get a fuller portrait of the spending habits of college students.
Note: we reference the most updated data available, but sometimes that information is from several years ago—check each individual source for specifics.
Spending power and income
College students are now more than 21 million strong, and their purchasing power largely comes down to educational and discretionary spending. While some students receive an allowance from their families, many of them also work seasonal or part-time jobs to supplement their incomes while earning degrees.
- Collectively, college students have an estimated spending power of nearly $600 billion. [Source: Refuel Agency]
- 67 percent of college students receive $2,000 or less from their parents each year. [Source: OppLoans]
- 44 percent of students work every year they are attending college. [Source: OppLoans]
- 86 percent of millennial college students work summer jobs. [Source: OppLoans]
- More than one-quarter of all college students have full-time jobs, even if they are full-time students. [Source: Urban Institute]
- Around one-third of college students listed as dependents have no income, while one-third of college students filing their own taxes earn $20,000 or more. [Source: Urban Institute]
- 74 percent of millennial college students contribute to funding their education. [Source: OppLoans]
- Back-to-school spending for college students averaged $1,200 in 2021. [Source: NRF]
- Total back-to-school spending for college students was estimated to reach $71 billion for the start of the 2021 – 2022 school year. [Source: NRF]
Student loans and debt
Student loan debt is at the forefront of the news, and many outlets are reporting on the struggles of millennials, baby boomers, and everyone in between. While the average student loan debt varies by age, state, and gender, the overall average is now around $37,000 per borrower. Other everyday costs like food and housing also contribute to the list of expenses college students need to cover while taking classes.
We found that most Americans would rather attend an affordable college than a highly ranked school. This shows that college students are highly aware of the costs of attending college and the financial sacrifices they may need to make. Read on to learn about the impact of college student debt.
- Total student debt is more than $1.5 trillion as of January 2022. [Source: U.S. Department of Education]
- Total student debt has increased by more than $500 billion in the past ten years. [Source: U.S. Department of Education]
- Student loan borrowers carried an average student loan debt of $37,113 in 2022. [Source: Education Data Initiative]
- The average monthly student loan payment for those with a Bachelor’s degree is $448 in 2022. [Source: Education Data Initiative]
- There are 45 million student loan borrowers as of January 2022. [Source: U.S. Department of Education]
- More than 3 million student loan borrowers owe $100,000 or more as of January 2022. [Source: U.S. Department of Education]
- Each year, 30 to 40 percent of undergraduate students take out loans. [Source: Urban Institute]
- Private student loan debt per borrower is on average $17,228 higher than federal student loan debt per borrower. [Source: Education Data Initiative]
- Nearly 4 of every 5 students report the high cost of education as the primary issue impacting them. [Source: Chegg]
- Over 50 percent of students said mental health was a primary concern throughout school due to financial strain and academic pressure. [Source: Chegg]
- Women hold nearly two-thirds of student debt in the country. [Source: AAUW]
- The cost of a college education has increased by 103 percent since 1987. [Source: AAUW]
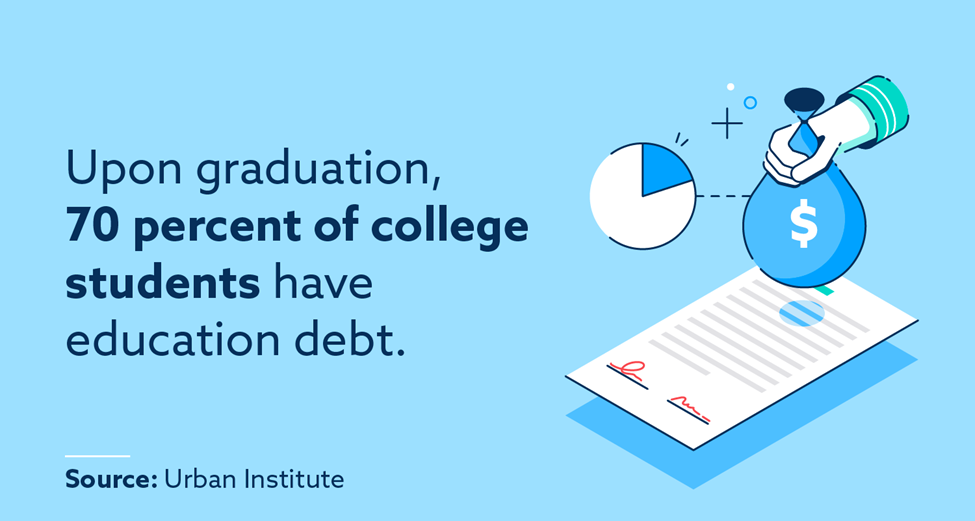
- Upon graduation, 70 percent of college students receiving bachelor’s degrees will have education debt. [Source: Urban Institute]
- 91 percent of millennial college students said they spend money responsibly. [Source: OppLoans]
- For millennial college students who received spending money from their parents, 45 percent report spending it “very responsibly,” but just 18 percent believed their parents would agree. [Source: OppLoans]
- 50 percent of low income families are worried about their ability to afford upcoming tuition payments compared to 30 percent of families overall. [Source: PR Newswire via Deloitte]
- 58 percent of families have a plan for how they’ll pay for their children’s college tuition. [Source: Sallie Mae]
- 20 percent of parents borrow money to cover their children’s tuition. [Source: Sallie Mae]
Tuition costs
Tuition costs have risen sharply in the past 60 years, and students have to find ways to deal with these rising costs. While costs vary between in-state and out-of-state schools as well as between public and private institutions, overall costs are extremely burdensome for anyone attending a four-year college. [Source: Education Data Initiative]
In-state public school total expenses (4 year)
- Total tuition: $37,396
- Total additional expenses: $64,552
- Total cost: $101,948
Out-of-state public schools (4 year)
- Total tuition: $108,092
- Total additional expenses: $64,552
- Total cost: $172,644
Private schools (4 year)
- Total tuition: $143,228
- Total additional expenses: $69,640
- Total cost: $212,868
Food and groceries
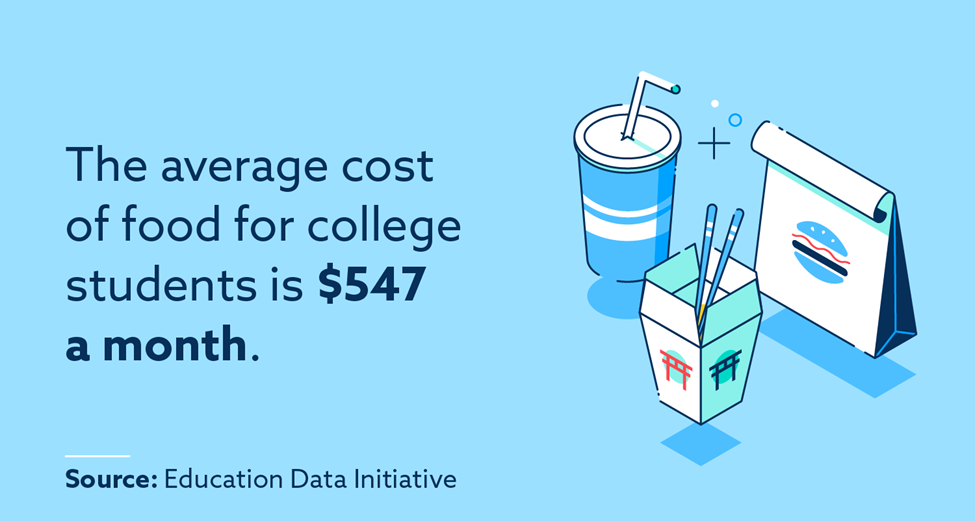
College students spend an average of $547 each month on food, including groceries, restaurants and meal delivery services. The rise of social media and the need to purchase things for status are a couple factors that encourage students to splurge on Instagram-worthy food. Here’s the lowdown on how students allocate spending for food in 2022.
- College students spend nearly $40 billion annually on food. [Source: Refuel Agency]
- Campus meal plans cost an average of $563 each month. [Source: Education Data Initiative]
- For millennial college students receiving money from their parents, 76 percent say they mainly spend it on eating out. [Source: OppLoans]
- 53 percent of millennial college students who receive spending money from their parents say they spend it on drinks and snacks. [Source: OppLoans]
- The highest monthly average grocery budget is for college students in Hawaii, totaling $430 each month. [Source: Education Data Initiative]
- The state with the lowest average college student grocery budget is New Hampshire at just $56. [Source: Education Data Initiative]
- The average college student spends $342 eating off campus every month. [Source: Education Data Initiative]
- On average college students spend $42 every month on alcohol. [Source: Education Data Initiative]
- College students spend nearly $100 each month on coffee. [Source: Education Data Initiative]
Books and school supplies
While the amount of course materials students are purchasing hasn’t changed, the cost of them is on the downward trend thanks to more affordable options like renting and digital copies. Read on to see different highlights of college student spending on course materials.
- Average spending on course materials has decreased 41 percent since 2007. [Source: On Campus Research]
- College students expect to spend $18.1 billion collectively on electronics for school, which is more than any other category. [Source: National Retail Federation]
- Students acquire an average of 7.7 required materials for the academic school year. [Source: On Campus Research]
- 40 percent of students choose not to purchase at least one of their assigned textbooks due to its high cost. [Source: FlatWorld Knowledge]
- 26 percent of college students use free methods to obtain course materials. [Source: On Campus Research]
- 49 percent of students opt to purchase used textbooks instead of buying them new. [Source: FlatWorld Knowledge]
- 47 percent of students who purchased at least one used textbook said they chose an older version of it for the sake of affordability. [Source: FlatWorld Knowledge]
- 30 percent of students said they didn’t buy any digital versions of their assigned textbooks. [Source: FlatWorld Knowledge]
- 65 percent of students who opted for digital textbooks purchased them individually, while 29 percent reported purchasing them through a subscription. [Source: FlatWorld Knowledge]
- 58 percent of students bought at least one assigned textbook on Amazon. [Source: FlatWorld Knowledge]
Clothing and personal care
College students are estimated to spend nearly $10 billion on clothing for the 2021-2022 school year. The rising trend of natural, eco-friendly products is one factor that is possibly driving purchases up in this sector. Take a look at the stats below to learn how much money college students sacrifice for clothing and personal care.
- Individual college students anticipated spending around $158.98 on clothing and accessories for the 2021 school year. [Source: National Retail Federation]
- 59 percent of millennial college students who received spending money from their parents said they would primarily spend it on clothes. [Source: OppLoans]
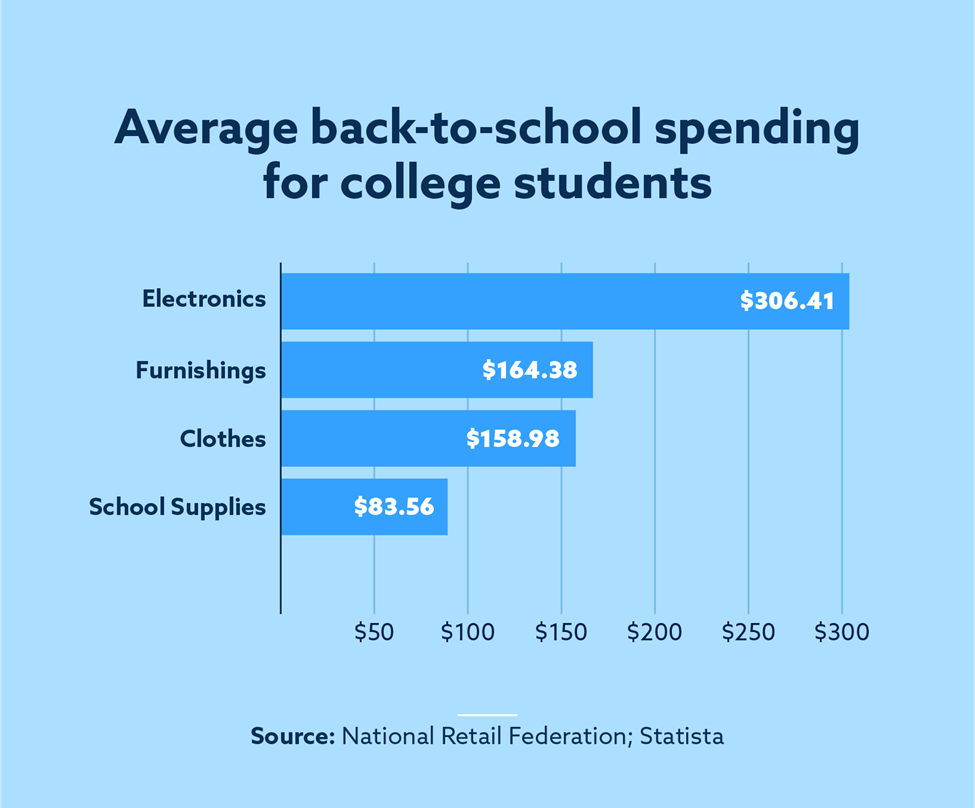
Take a look at what individual college students planned to spend on average during the 2021 – 2022 back-to-school shopping season:
- Electronics: $306.41
- Furnishings: $164.38
- Clothes: $158.98
- School supplies: $83.56
Housing costs
College students have many different options for housing during their time at school, including on and off-campus housing. The average cost of room and board has increased sharply in the past 60 years, and students now have to contend with finding ways to pay for housing in order to attend school at all.
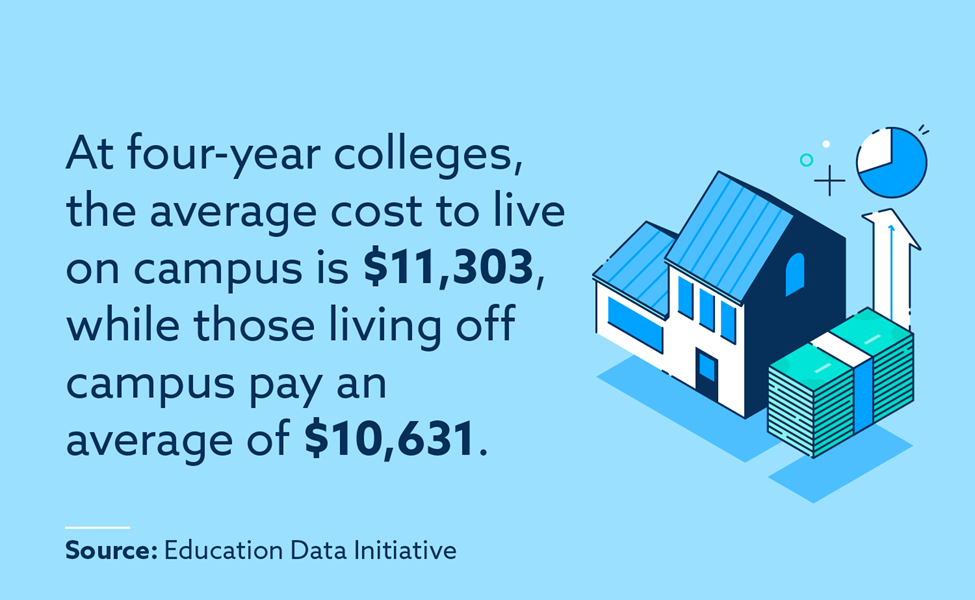
- Students living on campus at four-year public schools pay an average of $11,303 each year for housing. [Source: Education Data Initiative]
- Students at four-year public schools living off campus pay an average of $10,631 each year. [Source: Education Data Initiative]
- Around seven to 12 percent of the total U.S. rental housing market is taken up by student housing rentals. [Source: NHMC Research Foundation]
- The average cost of rent for student housing is $987 per month at public universities and $1,121 per month at private universities. [Source: Debt.org]
- Students living in a two-bedroom apartment pay an average of $1,178 each month for rent in addition to $162 each month for electricity and internet service. [Source: Debt.org]
- More than 70 percent of college students say the high cost of living is their main concern at school. [Source: Chegg]
The financial choices college students make can follow them for years after graduation. We’re all aware of the student loan crisis, but other financial decisions like late payments and maxed out cards can also take a significant toll if not immediately addressed. It can get particularly overwhelming if you haven’t checked your credit report in a while and feel unsure about what’s on it.
You should regularly check your credit report to ensure all of your information is accurate and fairly reported. If you need help tackling inaccurate negative items you find on your credit report, you can get in touch with the team at Lexington Law to learn about how credit repair might be able to help clean up your credit report.
Related Links
- American spending habits
- Baby boomer spending habits
- Teen spending habits
- Gen Z spending habits
- Millennial spending habits
Note: Articles have only been reviewed by the indicated attorney, not written by them. The information provided on this website does not, and is not intended to, act as legal, financial or credit advice; instead, it is for general informational purposes only. Use of, and access to, this website or any of the links or resources contained within the site do not create an attorney-client or fiduciary relationship between the reader, user, or browser and website owner, authors, reviewers, contributors, contributing firms, or their respective agents or employers.